

A lightweight page can take a long time on the server
Your page contains few images and scripts, but the browser waits before receiving its content. TTFB, or Time to First Byte, helps locate this wait. In a navigation measurement, it may include redirects, network address lookup and the secure connection, then waiting for the response. It therefore does not measure only PHP speed.
A small page may require a complex database query or wait for an external service. Conversely, a quickly served document may then display its large image slowly. This guide targets the first case: navigation that succeeds with a substantial initial wait. A 504 error, slow image or slowdown affecting administration alone requires its own diagnosis.
The desired result is a repeatable reduction in delay with the expected content and functions. The 0.8-second benchmark suggested by web.dev helps guide analysis; it is neither a guarantee for every visit nor a standalone Core Web Vital.
Prepare a record that enables comparison
Start without installing a plugin. You need the relevant public address and a recent browser. Record the time with time zone, network used and whether you are logged into WordPress. Choose an ordinary reading page, then a second page on the same site. Exclude payment URLs, logout URLs and links triggering actions.
Perform a few spaced openings without running a load test. Keep individual values: a slow first visit followed by fast visits does not mean the same thing as constant slowness. A comparison from another network may help, but it also changes the route and sometimes the CDN server used.
Changing content, plugins or cache will then require the corresponding permissions. On multisite, some settings depend on the super administrator. On WordPress.com, use tools supplied by the hosting service; do not transpose private-server instructions. Before tests that change behavior, prepare a copy with file and database backups and disable outbound payments, emails and synchronization.
Approach 1: find the slow phase in the browser
This approach suits anyone able to open the public page. In Chrome, the Network panel separates connection, waiting and downloading. The corresponding labels are Network, Headers and Timing. The option disabling browser cache does not disable server caches.
The expected result is identification of the dominant phase for the HTML document. If the document arrives quickly but rendering is delayed, continue analyzing rendering instead of adjusting PHP. To finish, close the tools and restore changed capture options.
- Open developer tools with F12, then Network. Enable Preserve log to retain any redirects and leave network throttling disabled.
- Open the chosen address. Select the Document-type request corresponding to the page rather than an image or advertising request.
- In Headers, record the status and final address. In Timing, compare DNS, connection, Waiting (TTFB) and content download.
- If 301 or 302 responses precede the document, record each destination. Repeat a few times under the same conditions and keep a screenshot of durations.
Fix a link imposing an unnecessary redirect
This fix suits an internal link you control that unnecessarily passes through an old address before opening the correct page. It requires permission to edit the page containing that link. Do not remove the redirect still protecting old external links: correcting the link source is enough here.
For example, a button may target an old HTTP URL redirecting to a domain variant, then to the HTTPS destination. Replace its target with the verified final address. This shortens that route; it does not reduce computation time for the final document. If the wait persists when opened directly, move on to cache and WordPress processing.
- Copy the final address of the document responding correctly. Check that it is the correct content and intended domain.
- In Pages, open the source page with Edit. Select the link or Button block, open its link setting and retain the old target in your notes.
- Replace only this target, apply the link and save the page.
- Open the public link and check its destination in Network. To undo, restore the retained old target; if an incorrect destination appears, correct it before continuing.
Optional measurement with curl from your computer
A user with curl can measure a GET request without downloading associated images and scripts. Run this example in a Linux or macOS terminal, replacing the fictional address with the selected public page. In Windows PowerShell, use curl.exe and replace /dev/null with NUL. Do not paste this command into a WordPress file.
Values are in seconds, measured from the start of the operation. They are not independent durations to add together. The example does not follow redirects: a 301 status measures that first response, not the final page. You must then measure its verified public destination separately. The twenty-second maximum limits client waiting without guaranteeing that server processing stops.
The expected result is a measurement line accompanied by headers. Repeat manually a few times without a rapid loop. This command changes no local or WordPress setting; no rollback is needed. Headers may contain cookies or infrastructure data: keep them private.
curl -q --silent --show-error --connect-timeout 5 --max-time 20 --dump-header - --output /dev/null --write-out '\ncode=%{http_code} dns=%{time_namelookup} tcp=%{time_connect} tls=%{time_appconnect} premier_octet=%{time_starttransfer} total=%{time_total}\n' 'https://exemple.invalid/page/'Interpret durations without attributing the cause too quickly
If DNS or connection accounts for most of the wait, start by comparing another network. Slowness limited to your computer, a corporate proxy or a region does not automatically implicate plugins. Keep the domain and HTTPS active: replacing the domain with its IP address changes the certificate, routing and sometimes the served site.
If connection is quick and waiting then dominates, look for delay after the request is sent. It may include the network route, CDN, a queue and WordPress computation. Subtracting connection completion from the first byte gives a clue, not a pure PHP measurement. Browser measurements may reuse a connection; a new curl command may open another.
103 Early Hints responses may also change the moment counted as the first byte. When the value looks very good but HTML arrives late, also examine the final response and download. Compare readings from the same tool. Code 000 with a curl error indicates an operation that obtained no usable HTTP response; it does not prove a 500 or 504 response.
Approach 2: check the HTML document cache
A page cache retains a reusable HTML response. An object cache retains computation or database results; it does not necessarily replace generation of the entire page. Finally, a CDN speeding up images does not necessarily retain HTML. Some CDNs cache static files without caching HTML documents by default.
With an administrator account, open Tools, Site Health, then the Status tab. Expand the result relating to page cache and response time. WordPress uses, among other things, homepage requests and cache clues; this check does not describe every page or every visitor’s route. An internal request error may prevent detection: do not install a second cache merely to respond mechanically to this message.
Then compare two public logged-out visits to the same URL without added parameters. Record cache indicators documented by your provider in headers where present. A faster visit alone does not prove a cache hit. A cart, account or personalized page may legitimately remain excluded. The expected result is knowing whether the measured document can be reused and at which layer.
Reenable managed global caching on WordPress.com
This approach concerns a public WordPress.com Business or Commerce site whose global cache was disabled for a reason no longer valid. It requires hosting settings access. On Free, Personal and Premium, this cache is always enabled according to current documentation; do not look for the same switch there. Do not make a private site public solely to improve response time.
Global caching brings responses closer to visitors. Before enabling it, check intended exclusions for your private or personalized pages. The object cache supplied by WordPress.com is separate and automatically active. Adding a competing server cache plugin is unnecessary for this approach.
- Open the WordPress.com hosting dashboard and select the relevant site title.
- In the sidebar, open Settings, then the Caching section under Server. Record the current global setting state.
- If the site is public and the preceding conditions are met, enable Enable global edge caching for faster content delivery.
- Open a few public pages in a logged-out session with spaced visits. Check content, delays and intended personalized workflows. If a problem appears, restore the initial setting and have the cache policy checked.
- Do not systematically click Clear all before each measurement: rebuilding may slow subsequent visits.
Approach 3: lighten an overly broad WordPress loop
This approach targets a page containing a native Query Loop block configured to display many posts, with slower generation than other pages. It requires permission to edit that page. First compare on the copy; reducing the post count also changes the content presented.
The example moves from a list of sixty items to twelve. These numbers illustrate a test, with no universal threshold or promised gain. Do not change an inherited archive query into a custom query to reveal a setting: you could change which posts appear. The approach below concerns a loop already customized.
- In Pages, choose Edit on the copy of the relevant page. Open List View and select Query Loop rather than its inner Post Template.
- In block settings, confirm the query type is Custom. Record the initial items-per-page count.
- In display options, make Items per Page visible if necessary through the three-dot menu, then reduce this value and save.
- Measure again under the same cache conditions. Check displayed posts and pagination. If the delay does not improve or presentation is unsuitable, restore the initial number.
Compare a plugin on an isolated copy
If slowness starts after adding or updating a plugin, you can compare its effect without a new tool. You need a functional copy, administrator account and a way to restore its files and database. Check that the copy’s outbound actions are disabled before opening it.
Choose a suspected plugin based on a dated change or recording. Do not deactivate the component providing the studied page: a page stripped of content is naturally different and does not validate optimization. Also avoid components essential to its dependencies or the cache being compared.
- On the copy, open Plugins, Installed Plugins. Record the selected component’s name, version and state, then reference measurements.
- Click Deactivate for this plugin only. Do not choose Delete. If dependencies block deactivation, stop this targeted approach.
- Reload the same page and check that its useful function still exists. Repeat measurements with comparable cache conditions.
- Reactivate the plugin, then check again. If slowness returns and content is comparable, you have a reproducible clue to send its developer before any production change.
Use Query Monitor to investigate WordPress-side work
Query Monitor is a free plugin by John Blackbourn, useful for observing the current load. Check the offered version’s requirements before installation. The plugin observes; it does not automatically fix slowness.
This optional approach requires an administrator, or a super administrator on multisite. Perform it on the copy without adding permanent diagnostics to production. A page served entirely from cache may not run WordPress and may not supply the desired record. An administrator session may itself bypass caches: its result is not every visitor’s result.
The expected result is a lead concerning generation time, SQL queries or external calls. This record concerns one opening, without a complete history or measurement of time before PHP starts working. To finish, deactivate Query Monitor in Installed Plugins.
- In Plugins, Add New, search for Query Monitor, check the author, install and activate on the copy.
- While logged in, open the slow page. In the administration bar, open the Query Monitor menu and Overview.
- Examine Timeline, then Queries, Queries by Component and HTTP API Calls according to the events present. Record duration and the associated component, keeping data private.
Read SQL queries and external calls
An SQL query is a request to the database. In Query Monitor’s queries panel, prioritize durations and responsible callers over query count alone. A plugin making a few very slow requests may cost more than one performing many fast reads. Duplicate queries guide analysis, but their presence does not justify deleting tables.
In HTTP API Calls, look for a service with a long wait, its status and the calling component. These exchanges originate from the WordPress server; they may be absent from the browser’s network request list. An external wait can explain a visually very simple page.
Then use targeted comparison on a copy or a documented setting of the relevant component. Preserve dependencies and the visitor-facing function. Do not arbitrarily block a license, payment or inventory service; do not randomly reduce its timeout. Send the developer the call, duration and involved version without tokens or personal data. If SQL time is low but generation slow, continue PHP profiling with a qualified person instead of blindly changing indexes.
Recognize hosting saturation
If all uncached pages slow down simultaneously, compare your readings with graphs available from the hosting provider. Look for the exact period, reached resource limits and scheduled processing. Labels vary by plan; a daily average graph may hide a short spike.
A PHP worker queue may delay the response before the execution measured by your diagnostic plugin. A remote or saturated database may also lengthen queries. A temporarily lightly loaded processor therefore does not rule out a limit. Do not randomly set a higher worker count: each process consumes resources and may worsen memory pressure.
Provide the reading URL, times and time zones, durations, cache statuses, versions and comparisons already performed. Ask for correlation with PHP queues, the database and logs at those times. This record helps decide between an application fix and a resource change without buying a plan solely on the basis of a score.
Check the correction with the same protocol
After each change, return to the two pages selected initially. Keep the same network and login state, then record several spaced durations again. Separate the first visit after cache invalidation from subsequent visits. A general purge before every test distorts observation and may add server work.
Compare the reduced delay with the content actually retained. Check links, pagination, login and relevant personalized pages. For a store, use only a designated test environment and test payment methods for transactional checks. Do not make a real purchase to time the site.
If only one measurement improves, keep the conclusion provisional. If the fault returns after reactivating the plugin or restoring the setting, the comparison becomes more useful. Retain details before deploying the targeted fix with its backup and rollback. Real visitor data may then confirm the trend; it does not necessarily update on the first reload.
Prevent excessive initial waiting from returning
Keep a small reference record: two representative URLs, dated measurements, cache conditions and the retained change. Repeat this protocol after a significant theme, plugin, cache policy or hosting change. This connects a regression to a concrete event.
On WordPress.com, the hosting dashboard’s Performance tool also provides a report for public pages available in its selector. Its overall score does not replace reading the document and its phases. On another hosting service, maintain the same discipline with tools actually provided.
Avoid stacking caches or optimizations without a prior record. A fast response must also remain correct, current and suitable for the visitor. Keep separate monitoring for main image rendering and interactions: improving TTFB helps them start without by itself guaranteeing a pleasant page.
Compare the same document without changing its weight
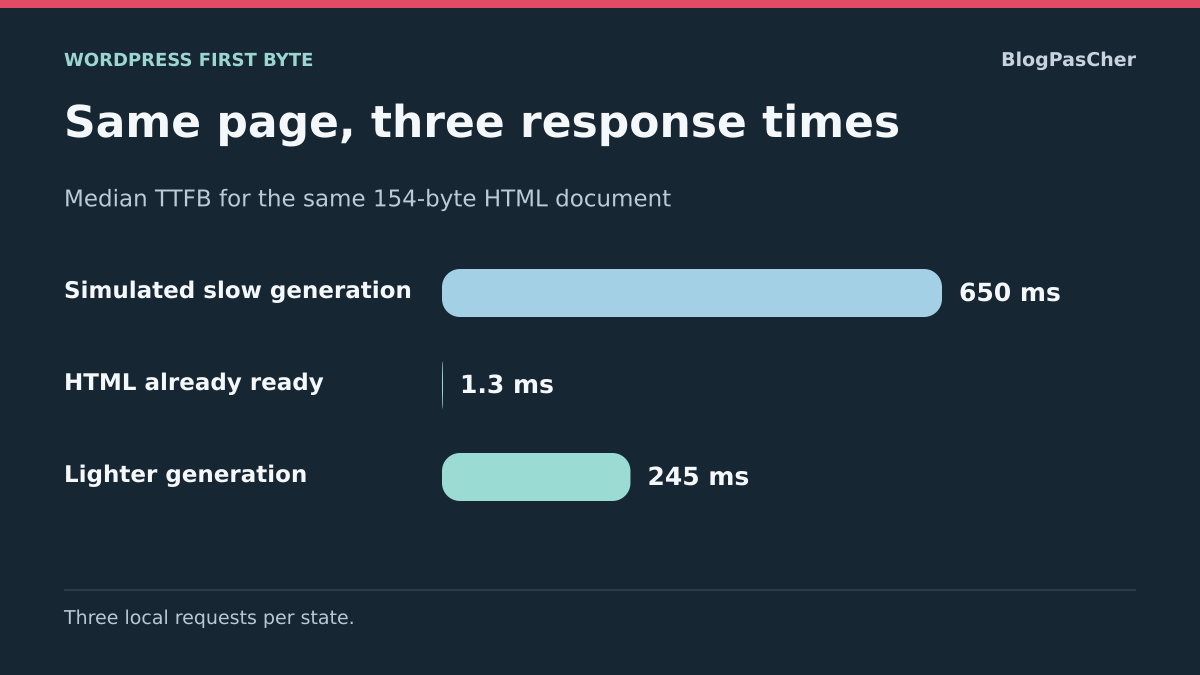
To isolate generation on a copy, compare the same document in two clearly identified states: response produced by WordPress and response reused by the intended cache. Retain its content and record several first-byte times with cache indicators.
A fast reused response can coexist with slow generation. If you lighten a component, also repeat a generation check in a comparable context. No numerical benchmark result is presented here as a measurement of your hosting.
Check page generation and reuse separately
If you have only browser access, use a logged-out window and record a few openings of the same document in Network. Keep the status, time and cache indicators specified by your provider. Compare displayed content and final destination. A timing difference invites investigation into which response was served. Have a cache hit or miss confirmed in logs if headers are insufficient.
If you have a copy and editing permissions, choose a page with slow generation. Take a reference measurement, then reduce work from a single component, such as an already customized loop. Repeat measurements with comparable cache states. Check the list, pagination and the function the page must provide. If content or navigation is no longer suitable, restore the previous version and record the first byte again. Simulating a wait does not replace identifying actual work in your theme or plugins.
Check restoration of the starting state
After comparison, restore only the tested change and record durations again. If the wait does not return, check cache conditions and other changes before attributing the gain to the component.
A local measurement does not reproduce visitors’ routes. Also compare their browsing conditions. If the document responds quickly but the main image is delayed, measure that image’s request and rendering separately.
Compare a cached response without mixing visitors
A logged-in/logged-out difference may be normal: the administrator often receives a computed page while a visitor receives a reusable version. To measure public caching, therefore keep a logged-out session and the same URL without adding a random parameter that might change the cache key. Record the provider’s documented indicator for every test.
Also compare content correctness. A very fast response that is outdated or personalized for someone else is not a success. After a test editorial change on the copy, check that invalidation refreshes the relevant page and private pages remain excluded. Do not force caching of those pages to improve a number.
The browser and existing hosting tools suffice for this first free comparison. Query Monitor then helps explain generation that remains slow; an external CDN does not eliminate this cost for requests it cannot reuse. To undo a cache test, restore the previous policy and check public content and the logged-in session, retaining the same reference pages.
Sources and references
Use these references to check the features, requirements and limitations described. Reading documentation is not a practical test.
View 17 references
- TTFB definition and measurement ↗
- Optimize TTFB ↗
- Chrome DevTools: network timing ↗
- curl: measurements and options ↗
- WordPress: optimization and caches ↗
- WordPress: page cache diagnosis ↗
- WordPress: persistent object cache ↗
- WordPress: Query Loop block ↗
- WordPress: managing plugins ↗
- WordPress.com: caches and enabling global caching ↗
- WordPress.com: performance tool ↗
- Query Monitor: listing, developer and compatibility ↗
- Query Monitor: use and measurement limits ↗
- Query Monitor: database queries ↗
- Query Monitor: timeline ↗
- Cloudflare: default cache behavior ↗
- PHP-FPM: concurrent request limit ↗