

Restore quick responses to clicks and keystrokes
The mobile menu hesitates to open, an accordion stays frozen after a click or typing seems delayed. Yet the page may have finished loading. INP, or Interaction to Next Paint, measures this responsiveness for clicks, taps and keyboard input during a visit.
The benchmark for good INP is 200 milliseconds or less at the 75th percentile of visits, distinguishing mobile from desktop. A local measurement helps explain a slow action; it does not by itself represent all visitors’ results. A visit without an eligible interaction does not provide the same information as a workflow actually used.
This guide aims to reduce unnecessary or excessive work without breaking page functions. It first suggests replacement with a native component when the need allows, then a plugin comparison. Per-page script removal remains an advanced, optional approach reserved for a file confirmed to serve no purpose there.
Distinguish initial visual feedback from the final result
The browser runs much of JavaScript on its main thread, which also prepares rendering and interactions. An overly long task can prevent a click from being processed immediately. This work may come from the clicked component, but also from another script busy at the same time.
INP does not necessarily measure the entire duration of a search or network response. An indicator can appear quickly, then results arrive later. Conversely, a small local operation may seem frozen if the browser cannot display its visual feedback. Measure these phases before concluding that the server or menu alone is responsible.
Do not confuse a loading test’s Total Blocking Time with a visit’s INP either. A laboratory score without a workflow does not tell you how each interaction responds. Choose a reproducible reading action, such as opening a menu or detail, and record precisely what is delayed: initial response, animation or data arrival.
Measure the same action in Chrome
You need the URL, a recent browser and a defined workflow. Record the window width, login state, relevant cookies and any CPU or network throttling. Phone simulation does not exactly reproduce real hardware; at least retain the same settings for comparison.
The expected result is a recording of the slow action with its duration and associated activity. Reports may contain URLs and page data: keep them in a private location. At the end, stop recording and restore any browsing conditions you changed.
- Open F12, then Performance. Reload the page and perform the chosen action once, without a real form submission or payment.
- Observe the local interaction measurement provided by the panel. Then start recording, reproduce a single slow interaction and stop.
- Select the event on the interactions track. Examine delays and the Main track to identify work occupying the browser around the action.
- Repeat before and after loading finishes. Keep several recordings of the same workflow instead of choosing only the best.
Read the waiting, processing and rendering phases
The first phase is the delay before the interaction handler can start. If it is long, look for the task already occupying the browser. The menu script may simply be a victim of other processing. Analytics activity, a carousel or a component loaded at startup may contribute to this wait.
The second phase corresponds to event processing. A handler that sorts a large list or rebuilds a lot of content may take too long. The third is the wait before the next paint, which can include style and layout calculations. Reducing only the number of files does not necessarily reduce this work.
In the trace, record the script URL and associated function when the tool provides them. Bottom-up or Call tree views help identify expensive activity. A combined or minified file may hide its origin: keep the trace and match it to installed components. This record helps choose a targeted comparison, not delete a file because its name appears in the report.
Approach 1: replace a simple accordion with the Details block
This approach suits an accordion used only to show or hide text whose third-party component contributes to slowness. It requires permission to edit the page. The native Details block can meet this need without retaining the same component. Do not use it to replace a form, calculator or more complex function.
Work on a copy and retain the old page version. Transfer the complete content, links and useful labels. Presentation will differ; the result to check is accessible content with a faster response to the action, not automatic reproduction of every visual effect.
- In Pages, open Edit on the copy. Add a Details block using the inserter, or type /details in a new block.
- Enter the visible summary and place the corresponding content inside. Check opening options and, if needed, the name grouping several details into an accordion.
- Remove only the old accordion from this page copy, without deleting its plugin or other content. Save.
- Check opening, closing, links and keyboard use, then measure the same action. If the function or presentation is unsuitable, return to the retained version.
Replace a secondary embed with a link
An external embed can add work without being essential to immediate reading. If a social preview or secondary player is not useful within the page itself, you can choose a descriptive link to the content. This decision changes the experience: the visitor leaves the page to view the resource. It is therefore unsuitable when embedded viewing is an expected function.
Editing permission and a retained version are enough for this test. On the copy, first check the destination address and the content it opens. The reduction in work must then be observed; removing the block does not guarantee its script is no longer loaded elsewhere.
- In the editor, add a paragraph where the secondary embed was. Write a clear label describing the resource.
- Select this text, use the link tool or Ctrl+K, enter the verified URL and apply the link.
- Remove only the replaced embed block and save on the copy. Check the destination, clarity and keyboard navigation.
- Measure the previously slow interaction again. To undo, restore the page version or retained block with its settings.
Approach 2: compare a suspected plugin on a copy
This approach is suitable when a dated change or trace points to a plugin. It requires a functional copy, administrator permissions and a file and database backup. Disable its outbound payments, emails and synchronization. A tool’s test mode does not replace this isolation.
Choose a single suspect. You must retain the interaction you measure: disabling the slow menu also removes the test. In that case, instead compare another confirmed competing activity or a prepared functional replacement. Keep necessary dependencies and comparable cache states.
- Open Plugins, Installed Plugins on the copy. Record the selected component’s name, version and state, along with the initial measurement.
- Click Deactivate for that component only. Do not choose Delete. If a dependency prevents the operation, do not arbitrarily expand deactivation.
- Replay the action and check that its useful function remains available. If it has disappeared, this comparison does not demonstrate faster execution of the same action.
- Reactivate the component and repeat the measurement. A fault that returns reproducibly provides a lead for the developer; retain the traces before any production decision.
Recognize dependencies and rendering work
A script may serve several functions, including less visible components: dialogs, form validation, mobile navigation or content accessible after login. A shared library may be called by another file. Its size or name is not enough to prove it is unnecessary.
Profiling may also show style or layout calculations rather than a long JavaScript handler. In that case, a page containing many elements or rebuilding a large section after every action may remain slow even with fewer files. A collapsed block sometimes retains its content in the document; hiding it is not equivalent to reducing this work.
Record the functions actually used on the page and in its intended states. If the script is necessary, move on to correcting its behavior with its developer. If it is confirmed unnecessary on this page only, local loading control may help. Do not use this step to globally remove jQuery, validation, a security control or a consent component.
Approach 3: test Asset CleanUp on a specific page
Asset CleanUp: Page Speed Booster, by Gabe Livan, can remove a JavaScript file from a page where it is unnecessary. The free Lite version provides per-page rules and Test Mode. Check the offered version’s requirements before installation; minimum compatibility requirements do not recommend using old, unmaintained versions.
Pro features, including broader rules or completely stopping plugins, are unnecessary here. No purchase is required for the described test. The tool does not decide for you whether the script serves a function or dependency.
This advanced approach requires a copy and an administrator. Before creating any rule, install Asset CleanUp through Plugins, Add New, checking the name and author. In Asset CleanUp, Settings, open Test Mode, enable the switch and click Save Changes. Retain the initial settings state.
Test Mode applies rules to authorized logged-in sessions; ordinary visitors see the unoptimized version. It does not separate content or the database and does not undo any saved rules. During this test, do not add combining, minification or general JavaScript deferral.
Create a single local unloading rule
The selected file must have been linked to expensive activity and confirmed unnecessary on this page. A gallery script is not unnecessary merely because the gallery is lower down or initially hidden. If you cannot establish this scope, keep the file loaded and pass on the trace for analysis.
The expected result is the absence of only the chosen file in the test version, with the interaction preserved and a measured improvement. An existing global rule or loading exception may change the result. In that case, examine existing rules without deleting them to force your test.
- In Pages, locate the copied page. Open its Manage CSS & JS link provided by Asset CleanUp, or its manager from the editor.
- In the CSS & JS Manager list, find the JavaScript file by its address and loading handle. Record its current rules.
- Select only Unload on this page. Do not choose Unload site-wide, a content-type rule or a regular expression. Click Update to save.
- In your logged-in test session, reload the page and check in Network that the file is no longer requested. Then replay the action, secondary functions and relevant states.
- If a function fails or the gain is unproven, uncheck only this rule and click Update again.
Leave Test Mode without applying a forgotten rule
Disabling Test Mode does not delete rules: it enables their application to ordinary visitors. Before this change, decide whether you are retaining the validated removal or simply ending a diagnosis. An external test run during Test Mode generally observes the visitor version and does not confirm your private setting.
To abandon the test, first remove the local rule and save. Check that the file returns, then restore Test Mode’s initial state. You can deactivate the diagnostic plugin if it served no other purpose. Retained settings may return on reactivation; record what was left in place.
To validate the rule for visitors on the copy, disable Test Mode and save only after checking. Refresh caches relevant to this page with the designated tools, then open a logged-out session. Recheck the file, functions and delays. Do not manually delete generated cache files: pages may still reference them. Deployment to production must repeat this validation and its rollback.
When the script is necessary, fix its work
Removing a necessary file is not a usable optimization. If the click handler performs too many calculations, the developer must reduce or distribute that work and allow prompt visual feedback. Splitting a function into several functions is not enough if everything still runs in the same continuous task.
The code maintainer can examine the amount of data processed, document updates and triggered presentation calculations. They can also separate nonurgent work into appropriate tasks. This adaptation depends on the component and its constraints; a generic JavaScript snippet pasted into the footer will not fix its handler.
Delaying all scripts until the first click may move the problem: that first action then triggers their download, preparation and execution. async or defer attributes do not remove the cost of work that runs afterward. Preserve dependency order and measure startup interactions as well as later ones. Give the developer the traces and exact settings state instead of accumulating exclusions you do not understand.
Check functionality, errors and the visitor context
After each change, measure the same action several times and check that it still produces the expected result. Also check the keyboard, mobile menu, content opened later and relevant logged-in or logged-out states. For a store or form, use the designated test environment and methods, without real submissions or payments.
Open the browser console to identify any new errors, then relate them to the change. A silent page is not complete proof of functionality; a single error does not always identify the cause of slowness. Repeat useful workflows, not just a screenshot of the first viewport.
Keep CPU, network and cache conditions comparable. An administrator session or real phone may produce a different result from a desktop test. If a function is missing, restore the block, plugin or removed rule. The chosen fix must improve responsiveness while preserving the visitor’s need.
Keep an actionable diagnosis and monitor changes
Keep the URL, exact action, measurement conditions, trace and involved component. Record settings and local rules with their rationale. Recheck after an update: a file may change its name, acquire a new dependency or become useful in another page state.
Field data available in PageSpeed Insights provides a trend for the URL or, failing that, the entire origin. It does not automatically identify the responsible click and does not immediately reflect your latest change. Missing INP data does not mean all interactions are fast.
If the fault persists, provide the component maintainer with the three observed phases and comparisons already performed. Specify whether the problem affects the first action, a repeated action or only mobile. This information helps choose between a simpler component, more limited loading and a fix to the processing itself.
Replay the same click and observe its first visible effect
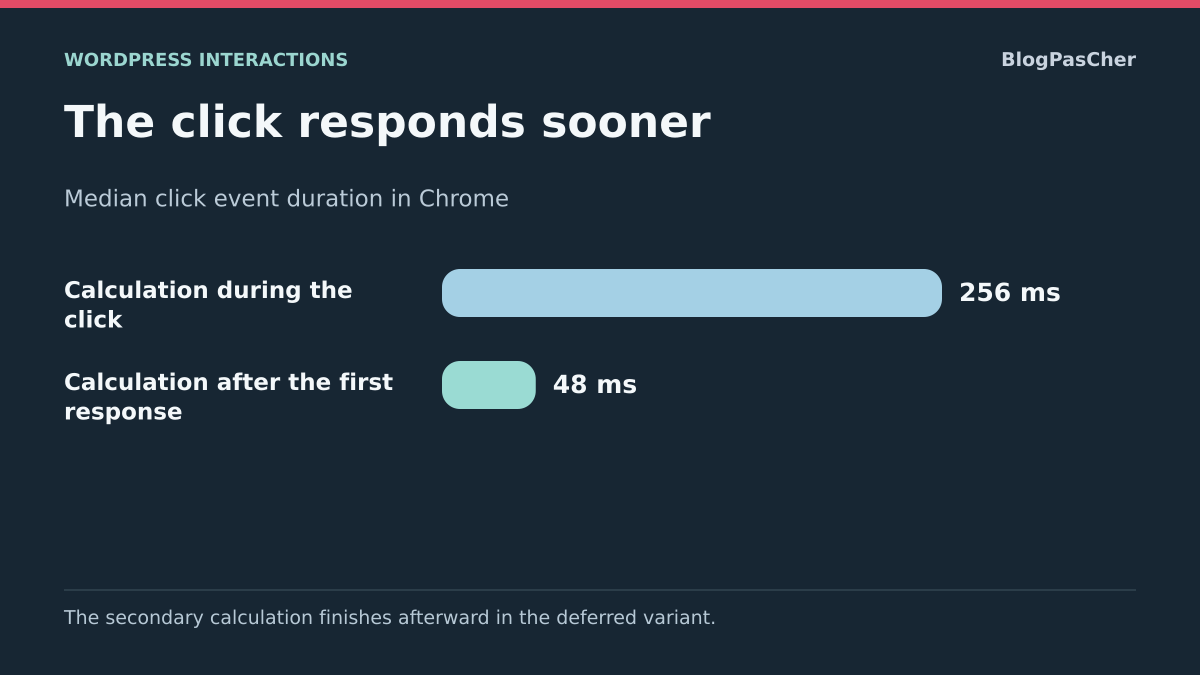
To compare immediate processing with deferred secondary work, prepare a test interaction with no business effect. Keep the same final result and record the first visible feedback, interaction phases and end of secondary processing. No numerical gain can be inferred before this recording.
To reproduce this check on your copy, choose a button whose result can be tested without a business effect. Record the text or state change expected immediately after clicking, then the final state. In Performance, start recording, click once and stop after the result. In the Interactions track, find the click and see how much delay comes from waiting before processing, executing its handlers and the subsequent rendering.
Check that deferred work completes correctly
A deferred calculation may remain a long task after the first visual feedback. On your component, check that the announced state matches what is actually available. If the result still depends on the calculation, display an explicit waiting state and update the result after completion. Preserve error handling.
Then replay a second relevant interaction shortly after the first. A deferred calculation may still interfere with the next click if it monopolizes the browser at that moment. If so, examine with the maintainer how to shorten or split the blocking work. On the copy, restore the previous version if the action order or function result changes. Repeat the complete workflow after reverting.
Compare local measurement with visitors’ experience
Keep several readings of the same action and the measurement conditions. They describe a local interaction without establishing INP for all visitors. To monitor that metric, relate the observed pages and actions to available field data.
If your recording shows a delay before processing starts, examine work already underway when the click arrives. If the handler itself takes most of the time, target that component before removing an entire script. If initial feedback is quick and a network result is delayed, keep the waiting indicator and measure the request separately. You can then check whether the fix concerns responsiveness, the final result or both.
Test the second interaction after deferring JavaScript
An optimization may improve the first click while delaying the next. Prepare a short real sequence: open the menu, choose a section, then open a detail. Run it without artificially waiting between actions, then repeat after loading finishes. Keep the same consent state and the same components available.
In Performance, look for a deferred task occupying the main thread at the time of the second interaction. If so, deferral moved the work; that processing still needs reducing or distributing. A favorable measurement of the first button is not enough to validate the page. For a necessary calculation, also check that visual feedback does not announce success before the result is actually available.
These observations use the browser’s free tools. Asset CleanUp is relevant only if the file can be removed without removing an expected function; it does not split necessary processing. After correction, check all three actions and their final result. If a step is missing or occurs in the wrong order, restore the original setting or component and pass on the trace of the complete sequence.
Sources and references
Use these references to check the features, requirements and limitations described. Reading documentation is not a practical test.
View 18 references
- INP: definition and benchmarks ↗
- INP: three phases and fixes ↗
- JavaScript: long tasks ↗
- INP: field data and attribution ↗
- Chrome: local measurements and recording ↗
- Chrome: profiling reference ↗
- WordPress: Details block ↗
- WordPress: paragraph link ↗
- WordPress: managing plugins ↗
- Asset CleanUp: version, author and Lite features ↗
- Asset CleanUp: scope of Test Mode ↗
- Asset CleanUp: per-page rules and priority ↗
- Asset CleanUp: jQuery dependencies ↗
- Asset CleanUp: cache and invisible rules ↗
- Asset CleanUp: deactivation and retained files ↗
- Asset CleanUp 1.4.0.6: official Test Mode settings ↗
- Asset CleanUp 1.4.0.6: Manage CSS & JS access ↗
- W3C — Event duration and interaction phases ↗