

A fast public site can conceal slow administration
The homepage opens quickly, but moving between WordPress screens takes several seconds. A post list, settings page or editor may require different work from the public site. A cached public page may even be served without recalculating its entire response, while administration runs processing specific to the logged-in account.
The desired result is usable administrative navigation with the expected data and functions. Determine whether the wait comes from the server response, a secondary request or the browser after receipt. Adding HTML caching to administration is not a solution: its pages contain user-specific information and actions.
The initial checks require your usual wp-admin access. Some settings or plugin tests then require an administrator, or even a super administrator on multisite. On managed hosting, use the access actually provided; lack of server access should not prevent you from recording the screen and request that are waiting.
Define the screen, account and timing of the slowdown
Record the slow screen’s address and what triggers the wait: opening, searching, changing pages, typing or saving. Compare a native list such as Posts, All Posts, a settings page and the main dashboard. A plugin-added screen may have its own workload and external calls.
Keep the date, time with time zone, browser and account used. Two accounts with different roles do not necessarily see the same data. Avoid creating an additional administrator solely for this diagnosis. If an authorized colleague sees the same fault, compare only useful observations without sharing credentials.
Start by opening something read-only. Do not repeatedly click Save or Update: an action may have succeeded while its response is delayed. Before a comparison that changes behavior, prepare a copy with file and database backups and disable outbound payments, emails and synchronization. Public changes must not serve as a stopwatch.
Read the waiting request in the browser
In Chrome, Network distinguishes the screen document from Fetch/XHR exchanges that may supplement it. The tools must be open during capture. Administration addresses, parameters and responses may contain private information: keep captures in an appropriate location and do not transmit cookies or tokens.
The expected result is an identified request with its status and dominant phase. If the document arrives quickly but the interface remains frozen, also look for a secondary request or JavaScript work. A long wait for the first byte is not, by itself, a pure PHP measurement. To finish, stop capture and close the tools.
- Open F12, Network, then a slow read-only screen. Keep network throttling disabled for this first recording.
- Select the administration document. In Headers, record its status; in Timing, compare connection, waiting and receipt.
- Then look at Fetch/XHR requests that take a long time or recur often. Record their path and when they occur.
- Repeat opening under the same conditions. Do not use functions for modifying or resending an administrative request to test it.
Approach 1: shorten an oversized administrative list
This approach suits a slow native list displaying many items at once. It requires only access to the list and its screen options. The number of items is generally a per-user preference for this screen; however, a plugin may impose its own behavior.
The test involves returning, for example, from one hundred rows to twenty. These numbers guarantee no universal gain. The change does not delete posts: it distributes browsing over more pages. Nor does it change the number of posts shown to visitors in the site’s Reading settings.
- Open Posts, All Posts. At the top of the screen, expand Screen Options.
- Record the current number of items per page. If it is high, replace it with a value reasonable for your work, such as twenty, then click Apply.
- Reload the list and compare several openings. Check that pagination still lets you reach other posts.
- If slowness does not change or the setting is unsuitable, restore and apply the initial value. If the number is ignored, have the list-customizing component checked instead of randomly editing the database.
Use filters to find content without a global operation
To find a post, use status, date, category or list search instead of displaying hundreds of rows. In Posts, All Posts, choose the desired filter and then Filter, or enter the title in search and run it. To return to the general view, remove these criteria and select All.
The expected result is a more manageable result set. This does not guarantee every search will be faster: searching a large volume or plugin-added sorting may be expensive. Compare a standard list opening with the specific slow filter to retain this distinction in the diagnosis.
Do not use bulk actions to test speed. Deletion, status changes or updates to many items may create additional work and change data. Hiding a column or widget does not prove its computation stops either: some components still prepare their data. Keep useful display preferences, but measure the result instead of automatically attributing a gain to their visual disappearance.
Compare a working session with fewer tabs
Several administration tabs may each perform exchanges and processing. For a simple comparison, keep a single read-only screen open after saving your work. Close unused tabs without interrupting an import, update or processing still underway. Wait for save confirmation, then close editor copies you no longer need.
The expected result is knowing whether the fault depends on accumulated tabs. If the wait persists with a single screen, do not conclude that tab count was the cause. You can reopen needed screens after the test; closing them is not a permanent site setting.
A private window also lets you compare a separate session with your own account. It changes cookies and some browsing conditions; it does not make the server more powerful. Browser extensions allowed in this mode may still act. If the problem remains confined to one browser, compare another browser already available or a controlled profile before changing WordPress plugins for everyone.
Distinguish AJAX, Heartbeat and plugin calls
The admin-ajax.php path does not identify a single function. Plugins and core may use it for different actions. In Network, select a slow request, then examine its form data or payload to record the action field when present. Keep other values private and do not replay the request for comparison.
Heartbeat is a periodic WordPress mechanism exchanging data with the server. It contributes, among other things, to renewing the editing lock. Its presence is therefore not an anomaly. A long or excessively frequent call requires identifying added processing and context instead of blocking the entire endpoint.
Record the action, observed frequency and duration with only one tab open. If it corresponds to a recognized component, compare that component on a copy. Do not globally disable Heartbeat, autosaves or REST access to make requests disappear: this may weaken protection of your work or other functions. A slow read action and a save action must not be treated as the same test.
Approach 2: compare a component on a copy
This approach suits a slowdown corresponding to a recently added plugin or identified request. It requires a functional copy and an administrator. Keep versions, the backup and activation state. The copy must retain the data useful to the measured screen, with external effects disabled.
The compared action must remain possible. Deactivating the plugin providing a management page also removes that page; its absence does not prove it is fixed. On a native list, however, a plugin adding a calculation or call can be compared if the list remains useful. Do not force deactivation blocked by dependencies.
- On the copy, open Plugins, Installed Plugins and record the selected suspect. Measure the reference screen before any change.
- Click Deactivate for this plugin only, without choosing Delete. Reload the same screen with the same account and criteria.
- Check available content and retained functions, then compare durations and relevant requests.
- Reactivate the component and check again. If slowness returns, keep evidence for its developer. If the result is ambiguous, restore the initial state before trying another hypothesis.
Use Query Monitor to investigate slow generation
Query Monitor is a free plugin by John Blackbourn that observes, among other things, SQL queries and HTTP calls during the current load. Check the offered version’s requirements before installation. Its role is diagnosis, without automatic acceleration.
This optional approach requires a copy and an administrator, or a super administrator on multisite. The Admin Screen panel identifies the current screen; it is not an automatic ranking of the slowest screens. A document recording is not a history of all AJAX requests launched afterward either.
The expected result is a component or operation to relate to the observed delay. Collection itself adds a cost: after diagnosis, deactivate the tool and repeat the useful comparison without it.
- On the copy, open Plugins, Add New, search for Query Monitor, check the author, install and activate.
- Open the slow screen, then the Query Monitor menu in the administration bar. Examine Overview for generation time.
- Consult Admin Screen to identify context, then Timeline, Queries by Component and HTTP API Calls according to the events present. Keep useful items in a private folder.
Connect SQL and HTTP requests to the correct screen
For SQL queries, examine durations and the responsible component rather than only the total count. A calculation added to every row of a large list may become expensive. Then compare row count using the screen setting already described and remeasure the same context. A duplicate query does not authorize deleting tables or options.
In HTTP API Calls, look for a wait on an external service triggered during screen generation. A license check, report or plugin component may wait for a response before WordPress finishes. These calls originate from the server; they do not necessarily appear as direct exchanges in the browser’s Network panel.
Keep the component, duration and any error without publishing tokens or customer data. Then use its documentation or comparison on a copy to confirm the lead. Do not randomly remove the relevant check: the replacement must preserve functionality. If observed requests are fast but generation remains slow, the cost may lie in PHP computation or before the measured execution.
When the browser stays busy after the response
If the document and useful requests arrive quickly but typing or menus hesitate, the problem may be in the browser. Compare the same screen in a controlled session with fewer tabs and no WordPress change. Performance tools can record an action and show prolonged JavaScript or rendering work.
A screen displaying many rows or blocks may also require substantial work after the response. Retain pagination tests and comparison of the relevant component. Do not add a delay to every administration script in an attempt to lighten them: their order may be necessary for the editor and its functions.
If the fault affects only the editor, also check that it is not a loading or JSON response error. An interface that no longer works is not merely slow. Keep exact errors and pursue the corresponding diagnosis. If examining typing or a menu, use a test draft on a copy rather than public content being edited.
Compare server resources despite a fast public site
A cached public response can hide the PHP and SQL workload administration encounters on every navigation. Generation time recorded by a diagnostic plugin does not necessarily cover the entire wait before a PHP process becomes available. A queue delay may therefore remain visible in Network without appearing as a very slow SQL query.
In hosting tools, correlate slowdown times with reached limits, processing queues and scheduled tasks. Labels and graphs vary by plan: ask for values at those times rather than a general opinion about server power. A whole-day average may hide a spike.
Do not randomly increase PHP process counts, memory or maximum timeouts. More processes may consume more resources without resolving the cause. Provide slow screens, durations, actions and comparisons already performed. If background tasks accumulate, investigate their own diagnosis; clearing their queue could delete necessary work or replay actions.
Validate useful navigation and saves
Return to the reference screen and compare several openings under the same conditions. Check pagination, filters, visible data and functions required by the account. If you used Query Monitor, retain its record, then check behavior without its collection.
For the editor, check saving a test draft on the copy and wait for confirmation. Do not save repeatedly in response to a wait. Then examine retained content and any errors. Smoother navigation must not come with lost text, missing validation or a disabled editing lock.
If a change is unsuitable, restore the screen preference, reactivate the component or remove the tested setting. Avoid a global production restoration to undo a user preference. Keep the backup and test details until the relevant accounts and screens have been checked.
Prevent recurrence and pass on an actionable diagnosis
Keep a short record with the screen, account or role, date, request and measurement conditions. Record the retained pagination preference and confirmed cause, if confirmed. A new plugin may add a calculation to a list or a request on every opening; recheck after important changes.
Do not confuse visual simplification with stopped processing, and do not disable WordPress work mechanisms to remove their requests from the report. Native tools suffice for initial comparisons; optional collection should answer a specific question.
If the problem persists, provide the developer or hosting provider with the screen, time and time zone, status, observed duration and before-and-after comparisons. Specify whether the delay precedes the response, concerns a secondary exchange or appears during interaction. This record enables targeted intervention without changing several site layers simultaneously.
Compare the public page and the actually slow screen
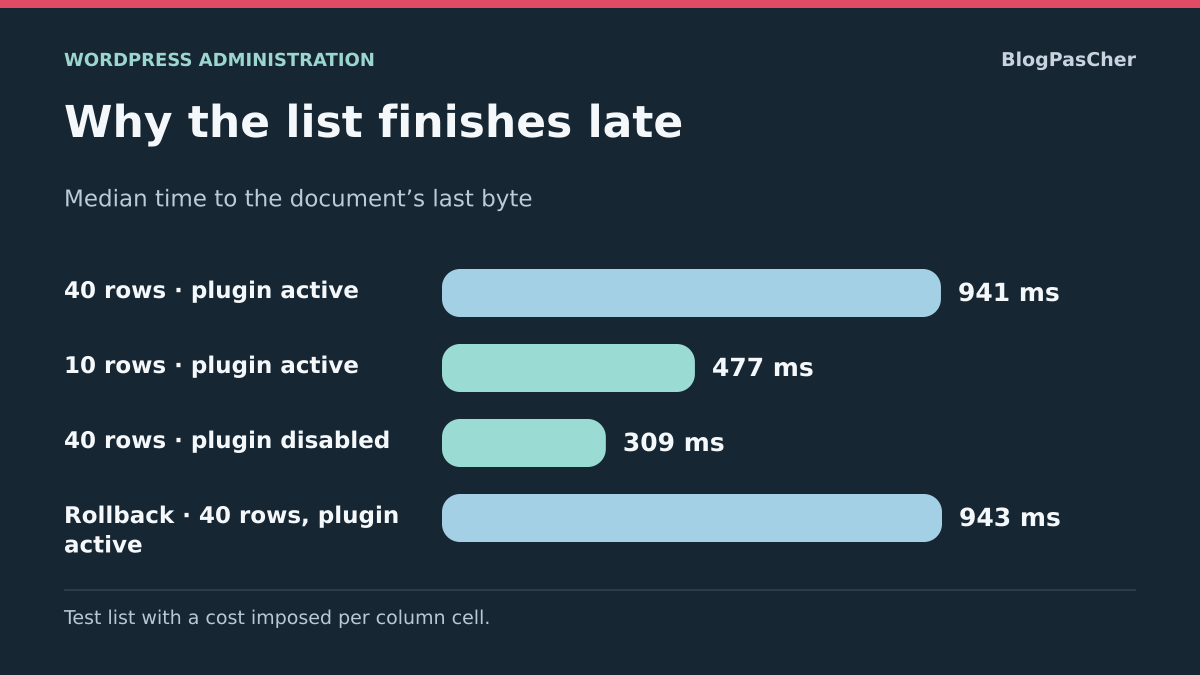
To compare the administrative list and a public page, retain a stable configuration and record the document’s first and last bytes. A response may start before the entire list is produced; these two measurements answer different questions.
On your site, record the slow screen’s exact path, account used, filter, results page and row count. Then open a public page in a logged-out window and measure its document. For the list, keep the same search and account between tests. If the administration document arrives quickly and the screen remains blocked afterward, move on to checking the browser and interface requests.
After a page loads, this short Console record provides two markers from the start of navigation. It reads measurements for the current document. Compare values over several openings of the same list.
const navigation = performance.getEntriesByType('navigation')[0];
console.table({
  premier_octet_ms: Math.round(navigation.responseStart),
  dernier_octet_du_document_ms: Math.round(navigation.responseEnd),
});
Measure row count before isolating a component
First compare two row counts with the same plugin and filters. To then isolate the component, restore the initial count before deactivating it on the copy. Otherwise, two simultaneous changes would prevent correct attribution of the result.
On the copy, start by recording the current item count. Reduce it in Screen Options and check that you can find other posts through pagination or filtering. To attribute cost to a component, restore the initial count before comparing with the plugin deactivated. If that plugin provides a necessary function, also check dependencies and the function it supplies. Deactivation diagnoses cost on the copy. A lasting fix may involve limiting the column’s work or having it run on demand.
Check restoration and useful functions
After comparison, reactivate the component and return to the initial row count. Check the filter, pagination and route to the editor. Record whether slowness returns with this change alone without presenting an isolated difference as definitive proof.
Provide the screen, filter, row count and component state with your before-and-after readings. These details allow the same scenario to be found in logs or an authorized profiler.
Separate a slow external call from row count
If Query Monitor shows a long HTTP call while the list opens, record its destination, component and duration. Then reduce row count without changing other criteria. A single call on every opening may remain just as slow with ten or fifty posts; a call repeated per row produces a different profile. This distinction avoids attributing every improvement or lack of gain to the database.
In the free tool, compare the current load’s calls and their initiators. A download performed directly by the browser appears in Network; a call issued by PHP may appear there only indirectly, in the document delay. Do not confuse the two timelines.
To correct it, look in the identified component for a documented refresh, report or synchronization setting. Retain its value and compare on the copy. If the call provides essential information, removing it is not a repair: instead give its developer the delay and error. After intervention, check that the list remains complete and required information is updated, then repeat the check without Query Monitor.
Sources and references
Use these references to check the features, requirements and limitations described. Reading documentation is not a practical test.
View 19 references
- WordPress: administration screens ↗
- WordPress: post list and options ↗
- WordPress: number of items per user ↗
- WordPress: preparing the post list ↗
- WordPress: Heartbeat API ↗
- WordPress: AJAX requests ↗
- WordPress: managing plugins ↗
- Chrome: requests, timing and data ↗
- Chrome: separate private session ↗
- Query Monitor: developer and compatibility ↗
- Query Monitor: use and current page load ↗
- Query Monitor: administration screen ↗
- Query Monitor: SQL queries ↗
- Query Monitor: timeline ↗
- WordPress: caches and server computation ↗
- PHP-FPM: processes and concurrent requests ↗
- WordPress: Heartbeat and editing lock ↗
- W3C — Document response timing ↗
- WordPress — Rendering a post list column ↗